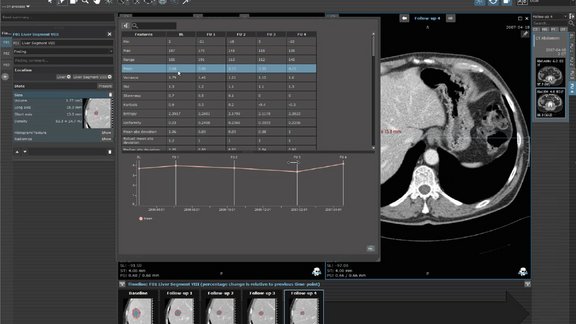
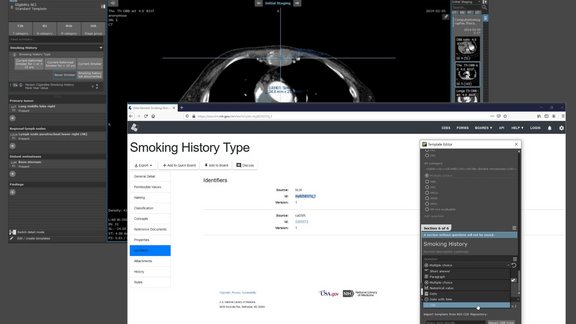
We talked to PD Dr. Wolfgang G. Kunz, Head of Oncological Imaging and of the Oncological Study Center at the Ludwig Maximilians University Hospital Munich, about his experience with mint Analytics, an extensive add-on of the leading radiological platform mint Lesion™.
Next to the data visualization of multiple trials, PD Dr. Kunz and his team use mint Analytics for quality control of trial site reads and for sharing the current status of trial results with oncological PIs, which provides them with an estimate of what responses can be clinically expected. PD Dr. Kunz also provides an insight into how mint Analytics has the ability to open up new avenues of single and multicentric research projects and how this can benefit other radiologists, oncologists, imaging CROs as well as sponsors.
Click here or on the image above to watch the full video on YouTube.


