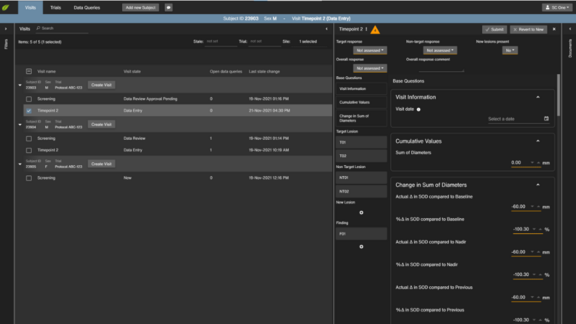
mint Analytics: Real-time data visualization and analysis in clinical trials with imaging endpoints

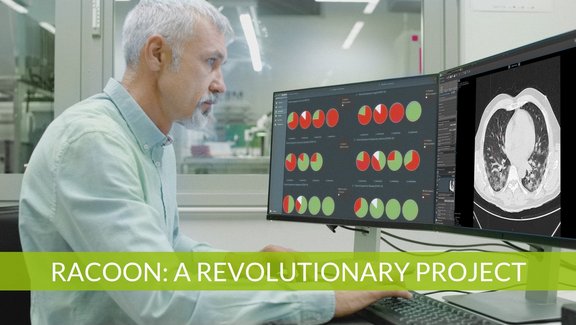
We talked to PD Dr. Wolfgang G. Kunz, Head of Oncological Imaging and of the Oncological Study Center at the Ludwig Maximilians University Hospital Munich, about his experience with mint Analytics, an extensive add-on of the leading radiological platform mint Lesion™.

Next to the data visualization of multiple trials, PD Dr. Kunz and his team use mint Analytics for quality control of trial site reads and for sharing the current status of trial results with oncological PIs, which provides them with an estimate of what responses can be clinically expected. PD Dr. Kunz also provides an insight into how mint Analytics has the ability to open up new avenues of single and multicentric research projects and how this can benefit other radiologists, oncologists, imaging CROs as well as sponsors.

Click here or on the image above to watch the full video on YouTube.

Related Resources

Related Resources

University Hospital Jena: Next-level Workflow Optimization in Clinical Trials

How to set up a well-running clinical trial center that can handle up to 40 trials at once has been successfully demonstrated by Laura Graziani, study…

Structured Reporting of Solid and Cystic Pancreatic Lesions in CT and MRI: Consensus-Based Reporting Templates of the German Radiological Society (DRG)

During the daily clinical routine, radiological reports on pancreatic lesions are often written as freeform texts. This causes several problems, in…

The benefits of structured oncologic reporting with mint Lesion™

Dr. Damiano Caruso of Sapienza Universita di Roma recounts how he got to know mint Lesion™ at a workshop hosted by the ESOI. Among other workstations,…